The Maths Society recently ran a stall at a local Spring Fair, where we gave visitors the opportunity to win a jar of Maltesers in our Malteser Teaser Experiment.
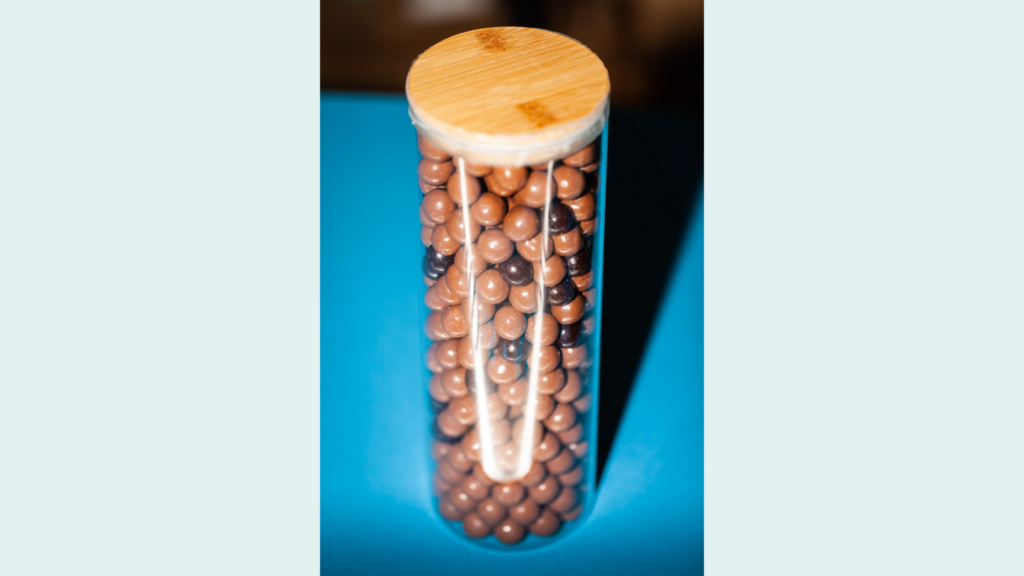
The objective was to calculate the number of Maltesers in the jar, and the person with the closest answer won the jar and all the Maltesers! The competition cost £1 to enter.
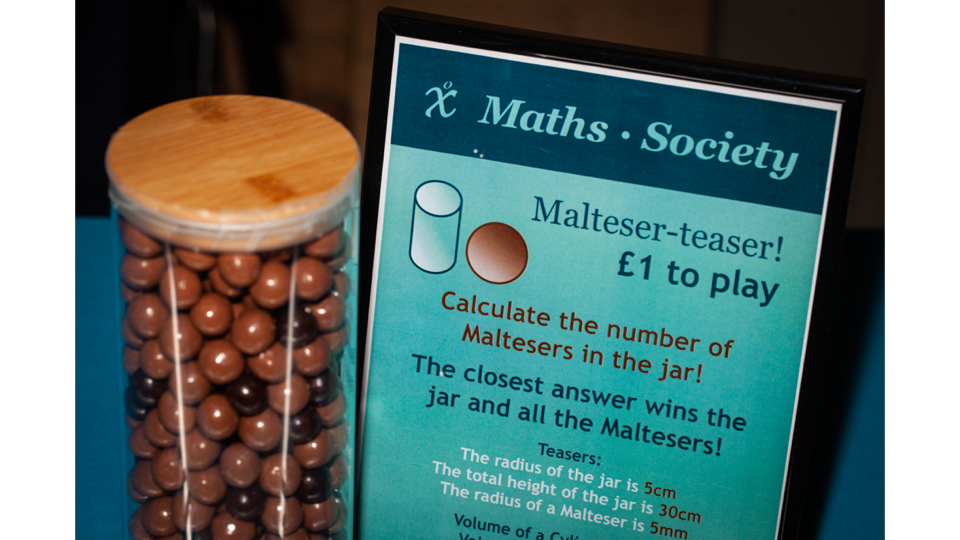
However, to make it easier for our players, we gave them a number of Malteser teasers to help them out, including the dimensions of the jar, ‘rough’ dimensions of a Malteser and the volume formulae for both spheres and cylinders — however this did not take into account the packing density of spheres (how big the gaps between them are), natural variation in the size of Maltesers or the width of the glass in the jar. So skill and judgement were required in reaching a solution.
You can have a go for yourself:
| Teaser | |
|---|---|
| Radius of the jar | 5cm |
| Total height of the jar | 30cm |
| Radius of a Malteser | 5mm |
| Volume of a cylinder | πr2h |
| Volume of a sphere | (4/3)πr3 |
As a Maths Society, we were also interested in exploring our results and seeing if we could find any statistical patterns, so we gave players the opportunity to say whether they had calculated or guessed their solutions.
At the end of the day, we had received an amazing 61 entries, 26 of which were calculated and 35 of which were guessed.
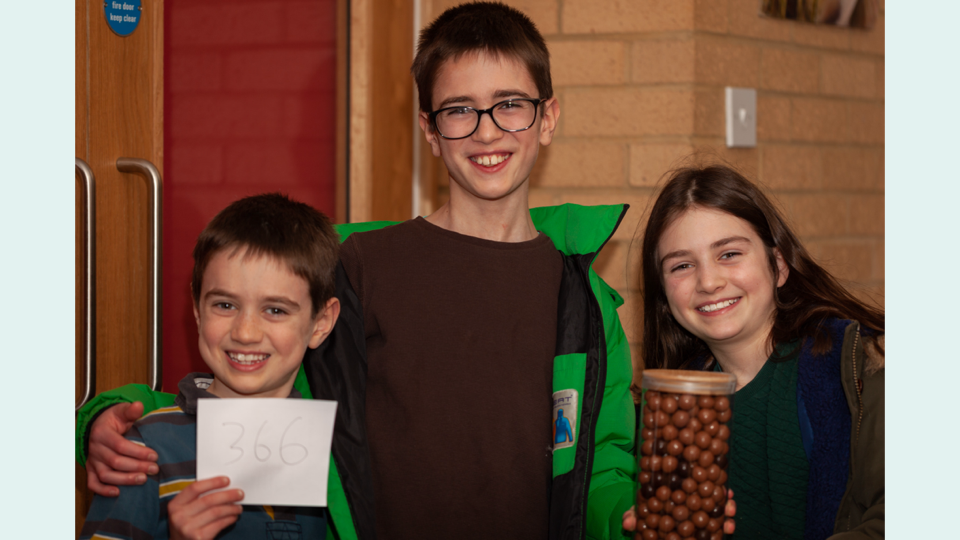
With two entries only 6 Maltesers off the actual number, we flipped a coin to work out our winner. A Sponce won the coin toss, with a calculated estimate of 360, however generously donated the prize to A Ball and his family (pictured below), who crowdsourced their guess of 372.
They won the jar — and 366 Maltesers — one for every day of 2024! What more could you want?
It is also worth noting our Treasurer, Daniel C, guessed 368 however as he was helping run the stall was unable to formally enter.
Excitingly, the Justice Secretary Alex Chalk MP was also at the Fair and calculated his own entry! We gave him one of our rose gold badges to remember the occasion, which we proceeded to wear at Cabinet and in the House of Commons!

The experiment, a mathematical variation on a traditional number-of-sweets-in-a-jar stall, was great fun to run for us, and between entries and badges, which we also sold at the fair, we raised an amazing £85 for Maths Society, to support us and our vision to bring the world of maths to everyone.
A massive congratulations to our winners and a big thank you to everyone who entered or bought and badge, and to A Sharma, C Cooper and D Chan who ran our stall.
The Statistics
After all the fun we had at the Fair, we decided to have a look at all the entries to see if there were any interesting statistics we could find.
Analysing all the data
| Statistic | |
|---|---|
| Lowest (cleaned data) | 99 |
| Highest (cleaned data) | 824 |
| Variance (all data) | 175882.5763 |
| Standard deviation (all data) | 419.3831567 |
| Variance (cleaned data) | 30261.27662 |
| Standard deviation (cleaned data) | 173.9576863 |
| Interquartile range | 189 |
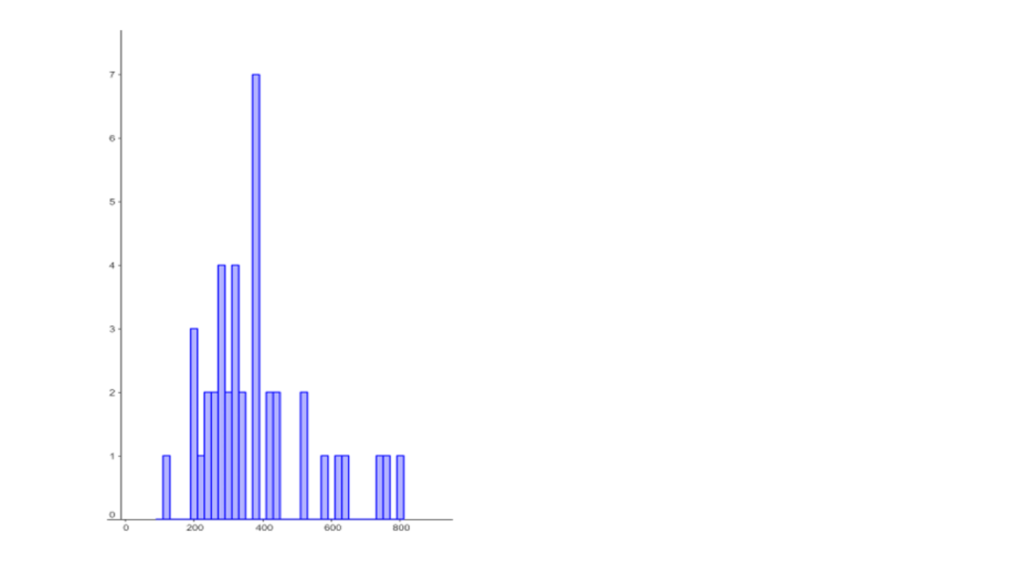
Data from guessed entries
| Statistic | |
|---|---|
| Mean | 377.025 |
| Mean (cleaned data) | 377.025 |
| Median (cleaned data) | 342.5 |
| Mode (cleaned data) | 200 |
| Lowest (cleaned data) | 118 |
| Highest (cleaned data) | 800 |
| Variance (all data) | 148659.5 |
| Standard deviation (all data) | 385.5639 |
| Variance (cleaned data) | 25213.92 |
| Standard deviation (cleaned data) | 158.7889 |
| Interquartile range | 106 |
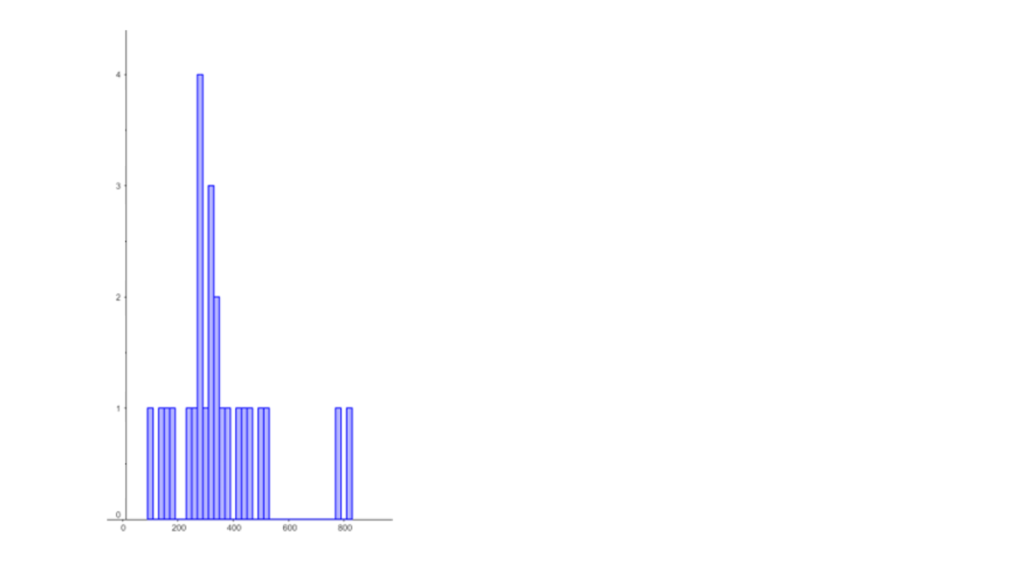
Data from calculated entries
| Statistic | |
|---|---|
| Mean | 425.7308 |
| Mean (cleaned data) | 351.96 |
| Median (cleaned data) | 322 |
| Mode (cleaned data) | 288 |
| Lowest (cleaned data) | 99 |
| Highest (cleaned data) | 824 |
| Variance (all data) | 169591.5 |
| Standard deviation (all data) | 411.8149 |
| Variance (cleaned data) | 29266.87 |
| Standard deviation (cleaned data) | 171.0756 |
| Interquartile range | 145.5 |
Comparing guessed and calculated data
It is evident from both the mean and the median of the two data sets that guessed values are closer to the actual number of Maltesers in the jar. The mode is not particularly representative due to the insufficient number of entries submitted.
To illustrate the spread in the data, we use variance, standard deviation, and interquartile range. The interquartile range is preferred over the overall range because it is based on values from the middle half of the distribution, making it less susceptible to outliers. When examining both data sets, the spread in the guessed values is significantly less than that in the calculated values.
Glossary
| Term | Definition |
|---|---|
| Mean | The average of a data set, found by adding all numbers together and then dividing the sum of the numbers by the number of numbers. |
| Median | The middle value of a sorted list of numbers. The middle number is found by ordering the numbers. The numbers are ordered in ascending order. Once the numbers are ordered, the middle number is called the median of the given data set. |
| Mode | The mode is the most common number that appears in your set of data. To find the mode count how often each number appears and the number that appears the most times is the mode. |
| Lowest | The lowest value in the data set. |
| Highest | The greatest value in the data set. |
| Variance | Variance is a statistical measurement of the spread between numbers in a data set. More specifically, variance measures how far each number in the set is from the mean, and thus from every other number in the set. Variance is often depicted by this symbol: σ2 |
| Standard deviation | A standard deviation, or σ, is a measure of how dispersed the data is in relation to the mean. Low, or small, standard deviation indicates data are clustered tightly around the mean, and high, or large, standard deviation indicates data are more spread out. |
| Interquartile range | Interquartile range is defined as the difference between the upper and lower quartile values in a set of data. It is commonly referred to as IQR and is used as a measure of spread and variability in a data set. This topic is often discussed in statistics with similar topics such as mean deviation and distribution. |
| All data | All the entries are part of the data set. |
| Cleaned data | Outliers are not part of the data set. |